Springtime Turbulence: The 1st Quarter 2025 Market Update
July 10, 2025 | Market Updates
Spring is in the air, and with it comes Spring Break. Many of us will be traveling by plane in the weeks ahead—I’m no exception. During these journeys, we’ve all heard the captain’s voice crackle over the intercom: “The seatbelt sign is now on. Please buckle up for possible turbulence ahead.”
It’s a fitting analogy for today’s stock market, which is navigating a pullback. When new information—like U.S. tariffs or DOGE-driven government layoffs—enters the news cycle, markets react. It can feel like a gust of wind rocking an aircraft. But just as a pilot relies on gauges to navigate turbulence, we at GreenUp Wealth use economic indicators to assess market conditions. Despite the current rough air, we believe the ongoing economic expansion will outlive the volatility in the financial markets. Our flight path may have been temporarily altered, yet our estimated time of arrival remains unchanged.
We always rely on four critical financial and economic gauges to determine whether market volatility signals a recession or a routine correction:
- Market Turbulence and its History – Past market patterns offer clues about what’s ahead.
- Consumer Spending – Accounting for 68% of U.S. GDP, a healthy, spending consumer drives economic expansion.
- Corporate Earnings – When consumers spend, U.S. corporations typically profit. Current earnings and future expectations reflect economic vitality.
- Government Bond Yields – These reflect a nation’s economic health and influence consumer borrowing rates, from mortgages to car loans.
These gauges provide insight into market risk. And they are indicating a persistent market expansion despite current turbulence. Let’s take a look at how GreenUp is reading these indicators, and adjusting our investments accordingly.
The Seatbelt Sign: Market Turbulence and Its History
The current market turbulence—a drop of at least 10% from recent highs, commonly called a correction—can’t be ignored. Paired with shifts in national economic policy, it feels unsettling. Yet corrections are more common than many realize. The chart below tracks corrections since 1980:
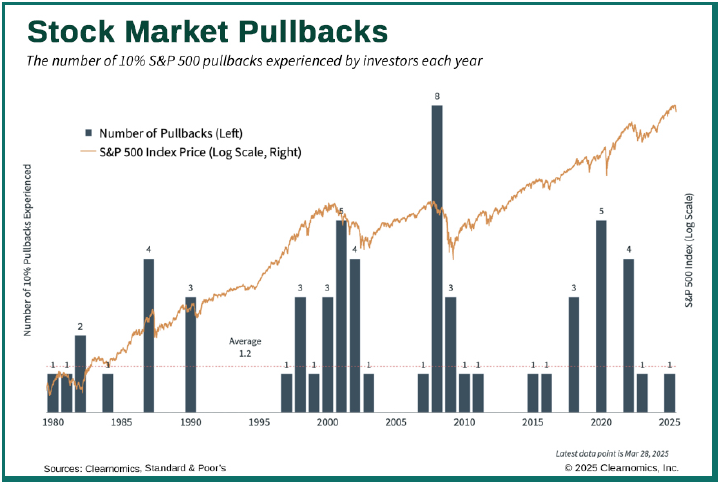
Two trends stand out:
- Corrections are routine, occurring 1.2 times per year.
- Corrections can precede recessions, though not always.
Digging deeper, corrections often accompany upward market trends during expansions, which typically last 4-6 years with average-to-above-average growth. When our gauges don’t signal a recession, these dips become buying opportunities, boosting long-term returns. However, when corrections do lead to recessions—marked by job losses and market contractions—our indicators help distinguish between a temporary dip and a broader downturn.
The Three Measurements: Gauges of Economic Stability
History encourages us to take caution, but we do have three economic gauges delivering critical information to help us ensure the smoothest and quickest trip possible. Our economic “cockpit” relies on three key measurements: consumer spending and health, corporate earnings, and government rates/yields.
Our Altitude: Consumer Spending and Health
Consumer spending, driving nearly 70% of U.S. GDP, is our altitude gauge. The story here is mixed but encouraging. Consumer confidence has slumped amid tariff talks, but hard data—job markets, wage growth, and spending—remains solid. Retail sales grew 3.2% year-over-year last quarter, easing worries about softening confidence. With wage growth outpacing inflation by roughly 1.5% annually, household balance sheets are robust, up 5% in net worth since early 2024.
Employment supports this strength. Despite projected government job cuts of 600,000– 800,000 in 2025, the labor market can absorb them. The chart below highlights this resilience:
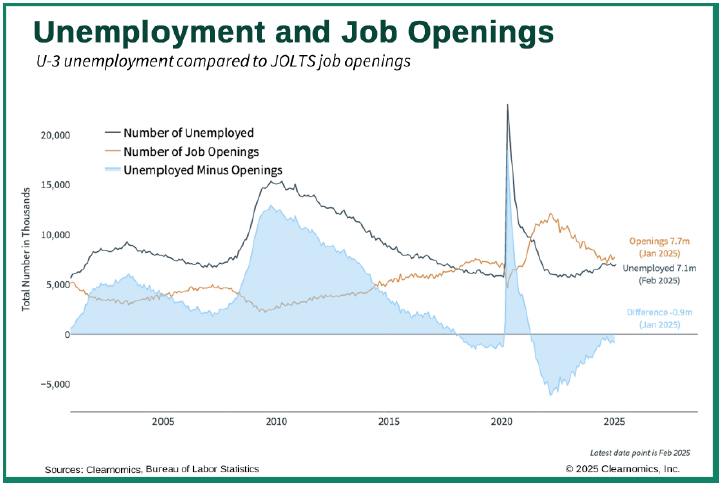
With 7.7 million job openings and 7.1 million unemployed individuals, the market could nearly employ every jobless person—plus those affected by federal layoffs. A strong labor market bolsters consumer health and signals a stable economy. This gauge holds steady, keeping us at a safe altitude.
Our Airspeed: Corporate Earnings
Corporate earnings continue to propel us forward. A thriving job market and healthy consumer depend on profitable companies. Corporate earnings momentum is consistent, and will likely continue to help propel economic growth.
The S&P 500’s performance often tracks earnings, as shown below:
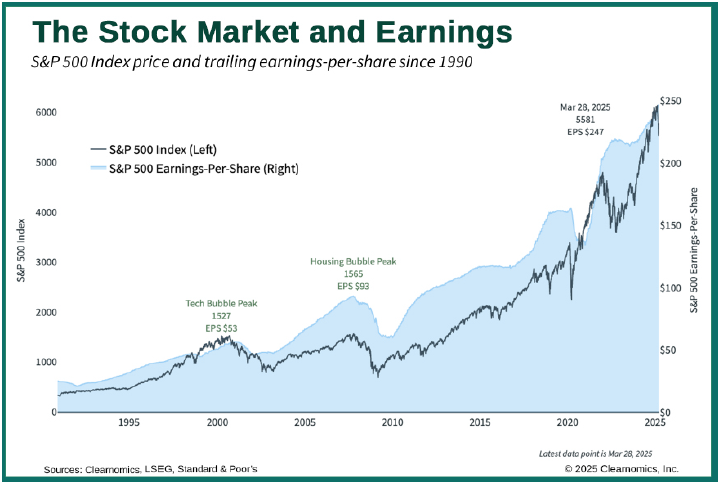
The good news? S&P 500 earnings surged 16.5% in Q4 2024, and analysts project 9%–15% growth through 2025. Looking ahead, analysts, admittedly optimistic, target the S&P 500 at about 6,600 by year-end, a 16% jump from today. While lofty, such expectations don’t align with recessionary conditions.
Our Heading: Government Rates/Yields
Government bond yields, our heading, guide our direction. This gauge reflects broader economic health: these yields reflect economic growth, inflation, and political risk, all of which influence consumer borrowing rates. The “risk-free rate,” what the government pays to borrow, sets the baseline for mortgages and loans. For example, in 2015, a 30-year mortgage averaged 4%; with poor credit, it might have been 5.5%. Today, March 27, 2025, it’s 6.7%, or 8.2% with subpar credit, which clearly illustrates rise tied to higher base rates.
The Flight Path: Stable Gauges, Clear Skies Ahead
Our gauges suggest a reassuring flight going forward into the rest of 2025. The U.S. economy has more control than headlines suggest. Market corrections of 10%–15%, like this one, are normal in bull cycles, and our indicators aren’t flashing recession warnings. With consumer spending, corporate earnings, and bond yields stable to positive, we’re on track for smoother skies.
As we navigate an eventful 2025, GreenUp Wealth will prioritize fundamental data while staying nimble as new information emerges. Should recessionary signals appear, we’ll adjust portfolios accordingly, but expansion remains our base case. With altitude, airspeed, and heading steady, we’re confident in the journey ahead.
GreenUp Portfolio Updates
Dynamic and ESG Portfolios
Net Decreases: The most significant reduction was in EPI, where we had scaled back its weighting, to manage risk or rebalance the portfolio. We also saw smaller net decreases in IVE, SLQD, AGG, WAVLX, FFSAX, CPITX, and IJT, indicating a more conservative allocation to these assets when compared to their increased weightings last quarter.
Net Increases: We had increased exposure to IVV, AVEM, NUEM, QQQ, AVUV, IJH, IVOG, and TLT, reflecting a strategic decision to enhance allocations to these assets, possibly to capture growth opportunities or improve diversification.
No Net Change: The weightings for IJU, IJR, TIPWX, VFLEX, CADUX, and MCNVX remained consistent, as these holdings continued to align with our long-term objectives and provided stability.
Index Portfolios
Net Decreases: We reduced exposure to QQQ, IUJ, IJT, AVDE, BIV, and HYG to manage risk and rebalance the portfolio. The largest reduction was made to SLQD, where we scaled back to lock in gains and adjust for market dynamics.
Net Increases: We increased allocations to VTV, IJH, IVOG, VBR, AVEM, and BLV, reflecting our confidence in these assets to capture growth opportunities and provide stability in the current market environment. Notably, SLOD saw the most significant increase in weighting, as we believe it is well-positioned to benefit from emerging trends.
No Net Change: Allocations to VB and SCHJ remained unchanged, as these holdings continue to align with our long term objectives and provide consistent performance.
Large Cap Stock Model
Net Decreases: The most significant reductions were in MSFT, AMZN, QCOM, ADBE, and MPWR, where we scaled back weightings, likely to manage risk or rebalance the portfolio. Smaller net decreases were seen in NVDA, TSM, TSLA, PANW, V, HCA, BALL, and PEP, indicating a more conservative allocation to these assets. Additionally, AAPL, MA, CEG, and MDT were completely removed from the portfolio.
Net Increases: We increased exposure to SCHW, ELV, LRCX, IQV, KMX, and OMC, with notable increases also in GOOGL and META. New additions to the portfolio included ORCL, CRM, JPM, MPLX, VST, APD, UNH, XOM, and ETN, reflecting a strategic decision to enhance allocations to these assets, possibly to capture growth opportunities or improve diversification.
No Net Change: The weightings for NVS, HWM, and SLB remained consistent, as these holdings continued to align with our long-term objectives and provided stability.
Equity Income Model
Net Decreases: SJM was completely removed from the portfolio.
Net Increases: We introduced a new position in VZ to the strategy
No Net Change: All other holdings remain at current weights
Tactical Equity Model
Our tactical signals triggered a move to cash for two days, with a move back into fully invested on March 18.
Tactical Income Model
No changes this quarter.
Past performance is not indicative of future results. The material above has been provided for informational purposes only and is not intended as legal or investment advice or a recommendation of any particular security or strategy. The investment strategy and themes discussed herein may be unsuitable for investors depending on their specific investment objectives and financial situation. Information obtained from third-party sources is believed to be reliable though its accuracy is not guaranteed, and GreenUp makes no representation or warranty as to the accuracy or completeness of the information, which should not be used as the basis of any investment decision. Information contained on third party websites that GreenUp may link to are not reviewed in their entirety for accuracy and GreenUp assumes no liability for the information contained on these websites. Opinions expressed in this commentary reflect subjective judgments of the author based on conditions at the time of writing and are subject to change without notice. No part of this material may be reproduced in any form, or referred to in any other publication, without express written permission from Firm. For more information about GreenUp including our Form ADV brochures, please visit https://adviserinfo.sec.gov
Author

Daniel Greulich, CFA CFP®
Chief Investment Officer | Wealth Advisor | Ann Arbor, MI -- Daniel leads our Investment Committee and partners with Aaron Kirsch, Chief Client Advocacy Officer to design and implement client portfolios with your advisor. Daniel brings 14 years of practical experience as a trader, financial advisor, and money manager at both large and mid-sized financial services companies to GreenUp Wealth Management. In addition, he holds a CFP® designation and is also a CFA charterholder. This combination of experience and knowledge helps Dan confidently guide his clients through the development, execution and monitoring of their customized financial plans.
All Posts